How we built real-time Kubernetes challenges in a browser
The architecture behind browser-based Kubernetes labs: xterm.js, Socket.IO, an assessment gateway, gVisor-sandboxed pods, and tmux for disconnect survival.
engineeringkubernetesarchitecturetechnical
The core assessment in SkillBricks is a candidate dropped into a real Kubernetes environment with a broken deployment, handed a shell, and asked to fix it. No multiple choice. No simulator. Real kubectl, real cluster, real RBAC, real events. Thirty to forty-five minutes to resolve the scenario, with an AI examiner observing.
There is a surprising amount of engineering under that sentence. This post walks through how the browser terminal, the gateway, the execution cluster, and the session state fit together - and the parts that looked trivial on a whiteboard and were not.
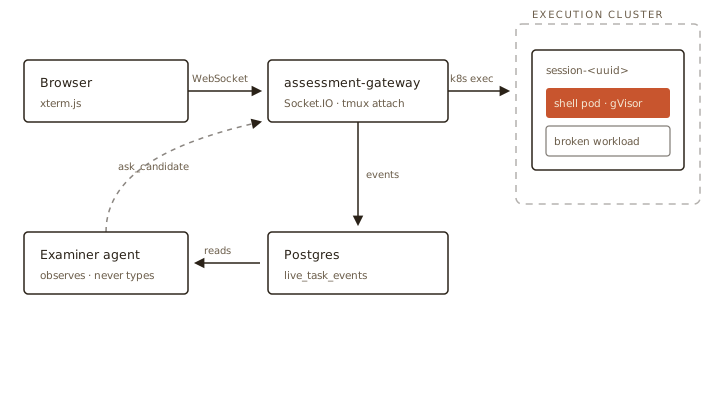
The short version: xterm.js in the browser, a dedicated assessment-gateway service in Node.js, Socket.IO over WebSocket, the Kubernetes exec API, gVisor-sandboxed pods on a separate execution cluster, per-session namespace with scoped RBAC, and tmux so flaky Wi-Fi doesn't destroy session state. Read on for the why.
The problem: a real kubectl in untrusted hands
The thing we are trying to do is straightforward to describe:
- A candidate opens a browser tab. A prompt appears, connected to a shell inside a pod on a cluster we operate.
- Whatever the candidate types, runs.
kubectl get pods,kubectl edit deployment,curl,dig,cat /etc/os-release. Real Linux, real kubectl, real network. - An AI examiner observes the session in real time, asks clarifying questions, scores across dimensions, and writes to session state.
- The candidate can close the laptop, lose Wi-Fi, reconnect from their phone ten minutes later, and pick up where they were.
- Nothing the candidate does affects any other candidate, any of our production services, or the cluster's control plane.
Every one of those lines hides an architectural decision that, if you get it wrong, either degrades the experience or creates a security incident. The interesting engineering is making (1)–(5) simultaneously true.
Why not a simulator?
The honest version: why not fake the kubectl responses and skip the infrastructure?
Play with Kubernetes, KodeKloud, and Instruqt have shipped products along a spectrum from "fully real cluster" to "scripted responses that look like kubectl output". The scripted end is cheap, safe, easy to scale - and gameable. If kubectl describe pod always returns the same events regardless of what the candidate did, the assessment collapses. If kubectl edit doesn't actually modify anything, the test becomes a pattern-match exercise: recognise the canonical "broken liveness probe" scenario, type the canonical answer, move on.
The skill we want to measure is diagnostic approach under genuine uncertainty. That requires an environment where the candidate's actions have real consequences, including making things worse before making them better. Every simulator eventually reveals its scripted seams to a candidate who probes hard enough.
So, real clusters. Now we pay the infrastructure bill.
The browser side: xterm.js and a WebSocket
The browser is the easy part.
The terminal UI is xterm.js, the same emulator that powers VS Code's integrated terminal. It gives us full VT100-ish fidelity: colours, control sequences, cursor positioning, vim, htop, and kubectl edit all work because $EDITOR works. Rolling your own <pre>-based terminal is worse along every axis.
On top of xterm we run a Socket.IO client. The choice of Socket.IO over a raw WebSocket is deliberate:
- A single duplex connection per session, multiplexed between terminal stream, examiner events, and control messages.
- Named event channels (
terminal.data,terminal.resize,session.end) rather than ad-hoc discriminators. - Reconnection logic we did not have to write from scratch.
The same Redis instance that backs our BullMQ workers and rate limiter is the Socket.IO adapter - shared infrastructure, deliberately.
The browser wiring is a few lines: socket events in, terminal writes out, resizes forwarded. Notice what is not there: no business logic, no session state, no command parsing. The browser is a dumb terminal. Every byte it types goes to the gateway; every byte it renders came from the gateway. This matters more than it looks, and we'll come back to it when we discuss disconnect survival.
The gateway: a dedicated service, not the main app
We run a separate Node.js service, assessment-gateway, at services/assessment-gateway/ in the monorepo. It deploys on the App Cluster and is the only thing in the system that talks to the Execution Cluster's Kubernetes API.
Three reasons it is not a route in the Next.js app:
- Different runtime profile. The gateway holds long-lived WebSocket connections and streams bytes. Next.js App Router is optimised for request/response - good at that, poor at 40-minute duplex streams.
- Independent scaling. Gateway pods scale with concurrent sessions; the UI tier scales with page views. Those curves do not match.
- Smaller blast radius. The gateway holds a Kubernetes credential for the Execution Cluster. Pinning it to one service beats giving it to the app tier.
The gateway is also where pluggable environment adapters live. The production implementation currently has one adapter, k3sNamespace, which provisions the per-session namespace this post describes. A feature-flagged k3d-in-pod adapter exists but is deferred. Terminal-streaming and session-lifecycle logic sits above the environment, so adding a challenge type later means writing one adapter, not re-architecting the gateway.
The execution cluster: separate, never colocated
This is the decision that makes the whole thing feasible from a security standpoint, and it is non-negotiable.
Candidate pods do not run on the same Kubernetes cluster as our application. In production, the App Cluster and Execution Cluster are two different k3s installs on different machines, connected over a private network. The Execution Cluster has no public ingress. The gateway reaches it via the private network, authenticated with a short-lived Vault-issued token.
A gVisor sandbox escape is low-probability, not zero-probability. If it happens on a cluster that also runs our Postgres, Redis, secrets, and user data, the incident is catastrophic. If it happens on a cluster whose only workload is short-lived candidate sandboxes with no persistent state worth stealing, the incident is embarrassing and fixable. We chose the recoverable failure mode.
Inside the execution cluster: gVisor, namespaces, RBAC, NetworkPolicy
A live session spins up a fresh namespace on the Execution Cluster containing:
- One shell pod as the candidate's environment.
ubuntu:24.04base pluskubectl,curl,dig,jq,vim,tmux, and challenge-specific tooling. - The broken workload the candidate is meant to diagnose - Deployment, Service, ConfigMaps, whatever the scenario needs.
- A scoped ServiceAccount with a Role bound to the namespace. The candidate can
kubectl get,describe,edit,delete,applywithin their own namespace. Nothing cluster-scoped, no other namespaces, no nodes.
Three defences keep this contained:
- gVisor (
runsc) as the RuntimeClass for every candidate pod. The user-space kernel between the container and the host narrows the syscall surface dramatically. The single most important piece of the sandbox story. - RBAC scoped to the session namespace. The candidate's kubeconfig, baked into the shell pod, points at the in-cluster API with a Role that can't touch anything outside
session-<uuid>. - NetworkPolicy denies egress by default. Allow rules cover only DNS, the in-cluster API server, and explicitly-whitelisted targets the scenario requires. No public internet from candidate pods, ever.
Pod Security Admission enforces the restricted profile at the namespace level: privileged, hostPath, hostNetwork, hostPID are rejected by admission before reaching the kubelet. An admission policy also rejects pods that omit or override the gVisor RuntimeClass. Belt-and-braces, not a substitute.
When the session ends - through completion or expiry of the scenario time budget stamped at session start - the entire namespace is deleted. No state persists inside the execution cluster. Everything we want to remember goes elsewhere.
The shell itself: kubectl exec streaming, wrapped in tmux
Once the namespace and pods are ready, the gateway opens a Kubernetes exec stream into the shell pod. Before handing anything to the candidate, it runs:
tmux new-session -A -s candidate -d && \
  tmux attach-session -t candidate
tmux is the least interesting piece of the stack and the one we would not give up.
The Kubernetes exec API streams bytes as long as the connection is alive. If the browser disconnects - closed laptop, bad train Wi-Fi - the WebSocket drops, and without tmux you either kill the exec stream (losing running processes and unsaved state) or keep it open without a consumer. Neither is acceptable.
With tmux we get a third option. The exec stream attaches to a long-lived tmux session inside the pod. When the browser disconnects, the gateway closes the exec stream cleanly and tears down the Socket.IO room. The tmux session - running processes, scroll buffer, vim state, half-typed commands - keeps running. When the candidate reconnects (30-minute resume window, two-disconnect cap, timer paused, hard deadline at the scenario's stated time budget), the gateway opens a new exec stream, re-attaches to the same tmux session, and the browser redraws the current terminal screen.
The candidate sees an uninterrupted terminal. tmux was purpose-built for this problem, just not for browsers. Wiring it into the kubectl exec path solved a category of issues that would otherwise have required a custom session server.
Session state: Postgres, not the client
Terminal state lives in the shell pod. The session state - events that matter for scoring, for the examiner, for the replay - lives in Postgres.
Every meaningful event is written synchronously to live_task_events, an append-only table. Connections, disconnections, resizes, command executions (parsed from the PTY stream, PII-scrubbed at write), examiner prompts, candidate answers, dimension scores, termination reason. Append-only via RLS; no UPDATE or DELETE surface from application code.
We do not depend on the client to hold anything. If a candidate's browser crashes and they reconnect from a different device, the tmux buffer comes back from the pod and the event history from Postgres. The client is, architecturally, a rendering surface.
The events table drives three things:
- Live examiner context. The agent reads the stream to decide when to probe.
- Post-session scoring and synthesis. An Opus-powered worker reads the event history once the session ends and produces per-dimension scores and the candidate-visible summary. Separate model call from the examiner: the same call never generates and scores.
- Admin replay. The
/admin/sessions/[id]screen replays from the event log, for auditing and dispute resolution.
Three-month retention on raw events, indefinite on denormalised summary columns on live_task_sessions - enough forensic depth without hoarding PII.
The examiner: observing without blocking the terminal
The AI examiner is a separate service (services/session-agent/), not a function inside the gateway. It subscribes to session events and decides independently. If it were inline middleware on the terminal stream, an examiner hiccup would stall the candidate's keystrokes. Unacceptable. The terminal must stream at PTY latency; the examiner sits beside the stream, not in it.
- The gateway writes events to
live_task_eventsand publishes a Supabase Realtime notification. - The session agent subscribes. On each event, and on a periodic tick, it runs a Claude tool-use loop.
- Tools are scoped and defensive:
ask_candidate,flag_moment,score_dimension,stay_silent. Norun_command, nomodify_cluster. The agent observes and speaks; it cannot touch the environment. - Agent messages write to
examiner_messagesand broadcast via Supabase Realtime on a separate channel from the terminal WebSocket, rendered in the chat panel next to the terminal. - Session ownership is claimed via
session_agent_claimswith a Postgres-heartbeat lock, so exactly one worker owns a session at a time under scale-out.
In-session decisions run on a mid-tier model, with a small classifier deciding whether each event warrants any reasoning at all (cheap filter before the expensive call). Post-session synthesis runs once, on a stronger model, from the whole transcript.
The examiner running next to the terminal rather than in front of it is the decision that lets us do AI observation without turning the terminal into a laggy mess.
What we are deliberately not doing
- No custom kernel modules. gVisor plus PSS plus NetworkPolicy is sufficient for our threat model; a kernel module would be a distraction and would lock us to a specific host OS.
- No exotic runtime beyond gVisor. Kata and Firecracker are defensible elsewhere. gVisor fits short-lived Linux sandboxes with a kubectl in them; we don't need microVM boot times.
- No reinvention of kubectl, kubectl exec, or the Kubernetes API. Every component we did not build is one we do not have to keep alive.
- No co-located candidate pods on the app cluster. Not even for dev, not even for demos. The topology is the security model.
- No persistent storage inside the candidate namespace. Scenario assets are seeded into the pod during session initialisation. When the namespace is deleted, nothing from the session persists in the Execution Cluster.
- No client-side session recording. Events come from the server. The client could lie; the server can't lie to itself.
Operational choices are boring on purpose: Pino for structured logging, OpenTelemetry through the gateway and into the agent, Prometheus for RED metrics, Loki with PII scrubbed at ingestion.
Why this is harder than it looks
The shape of the system is not novel. All the pieces exist, all are well-documented. What is hard is the composition - making the seams correct.
- Browser ↔ gateway: partial reconnects, slow networks, xterm.js and a remote PTY occasionally disagreeing on what a backspace means.
- Gateway ↔ Execution Cluster API: slow pod startup, namespace-delete races, Kubernetes sometimes taking five seconds to decide a pod is really scheduled.
- Terminal ↔ examiner: fully async. Any coupling between "agent took a moment to think" and "keystroke appears in the terminal" is a bug.
- Event log ↔ scoring worker: out-of-order arrival, retries, sessions that disconnect for 29 minutes and then finish normally.
- Security: gVisor, RBAC, PSS, NetworkPolicy, separate cluster - all of them, defended in depth, because no single layer is enough.
None of these are sexy. All are the difference between a demo that works on your laptop and an assessment platform you can put unknown candidates onto without losing sleep.
Where this goes next
Linux-container, AWS LocalStack and code-runtime challenge types (programming challenges with a file-tree and editor, not just a terminal) remain roadmap items rather than implemented adapters. The examiner agent gets more tools over time, informed by real sessions now that the platform is live.
If you want to experience the environment this post describes from the inside, that is the product - and for candidates it is free. Follow along via the blog as we ship the rest.