Context deadline exceeded: whose timeout fired, and what was actually slow
Context deadline exceeded means a caller-imposed timeout elapsed before the work finished. How to find whose deadline fired in Kubernetes, and what was slow under it.
kubernetesgotroubleshootingtechnical
Somewhere above your cursor is a command that just gave up. Maybe kubectl hung and finally printed Unable to connect to the server: context deadline exceeded. Maybe a helm upgrade --wait died at the five-minute mark, a pod's events filled up with failed probes, or the string turned up in an apiserver log you were grepping for something else. Different tools, same three words.
The internet's answer is tool-shaped: raise --request-timeout, raise --timeout, raise scrape_timeout, retry the pull. Sometimes that even works. But it treats a dozen surfaces of one error as a dozen separate errors, and it skips the two questions that make the fix obvious instead of lucky.
Because context deadline exceeded is not a Kubernetes error, a Helm error, or a Docker error. It is Go's standard sentence for one specific fact, and all of those tools are written in Go. Read it as "network flake, retry" and you will meet it again on worse terms.
What does "context deadline exceeded" actually mean?
It means a caller-imposed timeout elapsed: whoever initiated the operation attached a time budget to it, and the budget ran out before the work finished. The error reports a deadline expiring, never whose it was and never the cause; something underneath was slower than the budget allowed, and the message does not say what.
The phrasing comes from Go's context package, which is how Go programs pass deadlines down a call chain. A caller wraps work in context.WithTimeout (or WithDeadline, same failure, absolute clock), and every operation that is handed that context inherits the countdown (propagation is explicit in Go - work the context never reaches never hears about the deadline). When it expires, whatever was in flight aborts with the error value context.DeadlineExceeded, whose message is exactly this string. kubectl, the Kubernetes control plane, etcd, Helm, Docker, containerd, Terraform, Prometheus, and Vault are all Go programs threading contexts through their request paths, which is why the same three words haunt all of them.
It has siblings. context canceled (one l, Go's spelling) means the caller stopped waiting for a reason other than the clock: a shutdown, a Ctrl-C, a parent operation failing. gRPC wears the same fact as status code 4, DEADLINE_EXCEEDED. And Go's HTTP client appends its own decoration, (Client.Timeout exceeded while awaiting headers), which you will see verbatim from a kubelet below. One more mechanical fact matters later: Go cancellation is cooperative. The deadline firing makes the caller give up; the work underneath does not necessarily stop. Hold that thought until the retry trap.
So the diagnosis is always the same two questions. Whose deadline was it? And what was slow underneath it? The rest of this post is those two questions applied where engineers meet the string most, with every quoted error observed live on our dev cluster (k3s, Kubernetes v1.34).
Whose deadline fired? The owner signs the work
Every deadline has an owner: someone chose the number. In Kubernetes the owners sign their work. The client-side case first:
kubectl get namespaces --request-timeout=1ms
Unable to connect to the server: context deadline exceeded
A one-millisecond budget is absurd on purpose, and kubectl frames the expiry as a connection problem: from the client's side, giving up on its own clock and never reaching the server look the same. Rerun with -v=6 and the interesting part appears:
Get https://127.0.0.1:6443/api/v1/namespaces?limit=500&timeout=1ms: context deadline exceeded
That timeout=1ms is not just a local countdown. kubectl writes its budget into the request URL, telling the server how long it intends to wait. The owner signs the work, and the signature is everywhere once you look: the webhook line below carries ?timeout=5s the same way.
One number arms two clocks here: client-go enforces the budget locally, and the ?timeout= parameter asks the apiserver to bound the request server-side. In the one-millisecond run it was the client's clock: when the apiserver's bound fires instead, the client gets back an error response from the server saying the request timed out, whereas this is the client abandoning the attempt on its own.
The owners worth knowing by name, and the knob each one holds:
- Your client. kubectl's
--request-timeout(no timeout by default), Helm's--timeout(five minutes), and every CLI flag like them. - The apiserver. Its own
--request-timeout(a minute by default) bounds ordinary requests; it also imposes budgets as a client when it calls webhooks, kubelets, and aggregated APIs. - Admission webhooks.
timeoutSecondson the webhook configuration: ten seconds by default, capped at thirty. - Probes.
timeoutSecondson liveness, readiness, and startup probes: one second by default, tighter than many services under load. - The machinery beneath pods. Image pulls, CSI volume operations, and CNI network setup all carry deadlines from the kubelet and runtime.
- Controllers and operators. Reconcile loops wrap their API calls in
context.WithTimeout; when a third-party operator logs this string, the number came from its code, not from your manifests.
Position is the first clue, not a verdict - these errors travel up the chain, and the webhook line in the next section is the apiserver's budget yet lands in front of whoever ran kubectl apply. As likelihoods: printed by kubectl, usually the client's or the apiserver's request budget; in pod events, a kubelet budget; in apiserver logs, one of the apiserver's outbound budgets; in an operator's logs, its own. Confirm against the signature before acting.
The error announces that a clock expired; it never says which clock, and never which hop was slow. Working out the owner is the easy half; the owner is almost never the culprit.
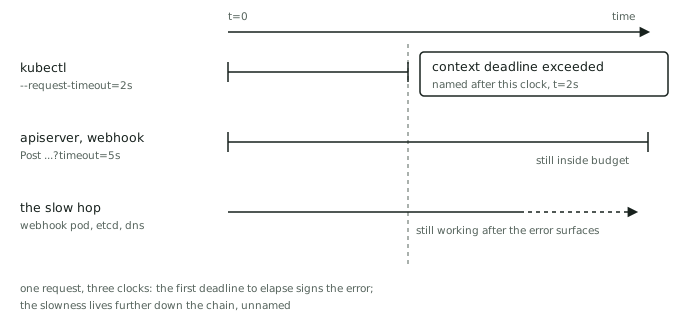
Why do admission webhooks make this error worse?
Because a webhook deadline does not just fail one call; it can fail everyone's writes. Before persisting many API requests, the apiserver calls each matching admission webhook, with that webhook's timeoutSeconds as the budget. Here is an organic line from our dev cluster's journal, wrapped for width but otherwise verbatim, from an afternoon when the webhook behind External Secrets was unreachable:
Failed calling webhook, failing closed validate.externalsecret.external-secrets.io:
failed calling webhook "validate.externalsecret.external-secrets.io":
failed to call webhook: Post "https://external-secrets-webhook.external-secrets.svc:443
/validate-external-secrets-io-v1beta1-externalsecret?timeout=5s": context deadline exceeded
The phrase doing the damage is "failing closed". That webhook's failurePolicy is Fail, so when its five-second budget expired, the apiserver rejected the request that triggered it. A slow or dead webhook with failurePolicy: Fail converts its own sluggishness into refused API writes for every object it matches, sometimes including the very deploy that would fix it. The alternative, failurePolicy: Ignore, fails open: requests sail through with that webhook's validation silently skipped - the rest of the admission chain still runs. One policy trades availability for safety, the other trades safety for availability, and a timeout is precisely the moment you discover which trade you made. And the person who sees the error is whoever ran kubectl apply, several hops and often a team boundary away from the slow webhook pod.
What was actually slow underneath it?
Question two is localisation: drop one hop below the deadline's owner and look for that hop's own evidence, rather than reading the error message harder.
If kubectl times out on a sane budget, ask whether the apiserver is slow for everyone or the path is slow for you: try a cheap read, check apiserver health and latency metrics if you can. Under a slow apiserver, etcd is the classic first suspect - not because it is always the culprit but because it confesses cheaply, in its own logs and disk-latency metrics rather than in the string that sent you looking. If etcd is clean, apiserver CPU saturation and a slow admission chain are the next suspects. If a probe timed out, the first suspect is your own application: garbage collection pauses, a saturated event loop, a cold start, a dependency it calls synchronously. Check the neighbours before blaming your code, though: when unrelated pods on the same node start failing probes together, the slow hop is the node - CPU pressure, DNS, the kubelet itself - not the application. If a webhook timed out, read the webhook pod's logs and resource pressure. If an image pull timed out, the slowness is registry, proxy, DNS, or the network between node and registry, and no amount of staring at the pod spec will show it.
Then correlate by timestamp, because this error is often weather rather than news. We grepped sixty days of our dev cluster's control-plane journal for the string. Most days had zero. A few days had one or two lines, each within seconds of a component restart, like the apiserver's availability checker probing a metrics service that was mid-reschedule:
failing or missing response from https://10.42.0.69:10250/apis/metrics.k8s.io/v1beta1:
Get "https://10.42.0.69:10250/apis/metrics.k8s.io/v1beta1": context deadline exceeded
And one afternoon had over three hundred, packed into little more than an hour while the datastore under the apiserver struggled. Same string, opposite meanings. A blip at restart time is the control plane missing a deadline and recovering, which it does routinely; the same line sustained for an hour is a dependency in real trouble. The distribution, not the message, tells you which you have; reading it is the same evidence-first habit as the wider troubleshooting loop.
A repro you can run
The kubectl experiment above takes ten seconds. This one shows the kubelet as owner, and what the expiry sets in motion: a tiny HTTP server that takes ten seconds to answer, probed with a one-second budget.
apiVersion: v1
kind: Pod
metadata:
  name: slow-probe
spec:
  containers:
    - name: app
      image: python:3.12-alpine
      command:
        - python
        - -c
        - |
          import http.server, time
          class H(http.server.BaseHTTPRequestHandler):
              def do_GET(self):
                  time.sleep(10)
                  self.send_response(200)
                  self.end_headers()
          http.server.HTTPServer(('', 8080), H).serve_forever()
      livenessProbe:
        httpGet:
          path: /
          port: 8080
        initialDelaySeconds: 3
        periodSeconds: 5
        timeoutSeconds: 1
        failureThreshold: 2
Apply it in a scratch namespace, wait a minute, and read the events. Ours said:
Liveness probe failed: Get "http://10.42.0.104:8080/": context deadline exceeded (Client.Timeout exceeded while awaiting headers)
There is the whole family in one line: the kubelet's Go HTTP client, a one-second context, and net/http's decoration on the end. The deadline was only the beginning, though. Two failures hit the threshold, the kubelet restarted the container, and lastState.terminated showed exitCode: 137 with a forty-second lifetime: the kill decision landed at about ten seconds (probe arithmetic, as the crash-loop post computes it), then Python, running as PID 1 with no signal handler, never saw the polite SIGTERM and sat out the thirty-second grace period until SIGKILL (the exit 143 post explains why PID 1 changes the rules). One under-sized probe timeout, and the visible symptom three links down the chain is an exit code 137 that looks like a memory problem and is not one.
Is raising the timeout ever the right fix?
Sometimes, and it matters when. The one-second probe default is genuinely tight for a JVM warming up or a handler that occasionally hits a slow downstream call; a five-minute Helm budget is genuinely short for a rollout that pulls large images onto slow disks. Measuring the operation's honest latency and sizing the budget deliberately is the boring, correct fix, the same way right-sizing a memory limit from observed data is.
Raising the number because it is the knob nearest the error is a different act. If the budget was fine last month and fires today, the slowness is new, and a bigger budget does not remove it; it hides it, moving the failure into your users' patience instead of your logs. Worse is the retry reflex. Remember that cancellation is cooperative: the timed-out work may still be running on the far side, so a client that retries immediately stacks a second copy of an expensive request onto a dependency that could not finish the first. A fleet of clients doing this at once is how a slow apiserver becomes an unreachable one. Retry with backoff, jitter, and a cap on attempts - that buys time while you answer question two, but it is a splint, not the fix, and for a non-idempotent write it is not even safe until you know whether the first attempt landed.
What the two questions cannot tell you
The two questions locate the failure, they do not root-cause it. Why etcd's disk went slow, why the handler pauses, why the registry crawls at 4pm: that is the next investigation, and no error string will do it for you.
Where we fit in
The skill in this post is not knowing that a Go context expired. It is the localisation move: taking an error that names a clock instead of a cause, working out whose clock it was, and following the chain down to the hop that was actually slow, with evidence at each step. The move is domain-independent; Kubernetes just happens to be where you practise it.
It is also exactly what a live assessment can see and a multiple-choice quiz cannot. On SkillBricks, you work failures like these in a real cluster namespace while the assessment watches the process: whether you found the deadline's owner and the slow hop underneath, or raised numbers until the errors stopped. Verified diagnosis becomes a brick on your wall, and the wall speaks for you. If you read the webhook section thinking about your own cluster's failurePolicy, that instinct is worth proving.