Five Kubernetes troubleshooting scenarios that separate practice from theory
Practise diagnosing CrashLoopBackOff, ImagePullBackOff, Pending pods, unreachable Services and OOMKilled containers through real troubleshooting paths.
kubernetesdevopstroubleshootingtechnical
There is a reliable way to tell whether someone has operated Kubernetes or studied it: give them a broken namespace and watch the first ninety seconds. People who have read about Kubernetes start explaining. People who have run it start looking - kubectl get pods, then describe, then logs, narrowing as they go.
These five scenarios cover a large share of real-world Kubernetes failures, and they come up constantly in interviews for exactly that reason. For each one: the symptom, the diagnosis path that experienced engineers actually follow, and the underlying model that makes the fix obvious instead of memorised. Work through them in a real cluster - k3s or kind on a laptop is enough - and break things yourself. Reading this post is the theory; causing and fixing each failure is the practice.
1. CrashLoopBackOff
Symptom: kubectl get pods shows CrashLoopBackOff, restarts climbing.
The path: The container starts and then dies, repeatedly, with backoff between attempts. Your first question is always: what did it say before it died?
kubectl logs <pod> --previous
kubectl describe pod <pod>
--previous matters because the current container may have no logs yet. From describe, read the last state and exit code. The exit code splits the problem in half: 1 and friends usually mean the app itself crashed (bad config, missing env var, unreachable database), 137 means it was killed, often but not always by OOM (see scenario five), and a near-instant exit with no logs suggests a bad command or entrypoint.
One special case catches people out: the app is healthy but the liveness probe is wrong, so the kubelet kills a working container over and over. If the logs look normal right up to each death, read the probe in describe before touching the app. And when the probe is timing out rather than being refused, the events say context deadline exceeded: the kubelet's own clock expiring, an error family with its own diagnosis.
The model: CrashLoopBackOff is not an error, it is a symptom category. The kubelet is telling you "this container keeps exiting and I keep restarting it." Everything hinges on establishing who initiated each exit: the process itself, the kubelet acting on a probe, or the kernel enforcing a limit.
2. ImagePullBackOff
Symptom: Pod stuck in ImagePullBackOff or ErrImagePull; no container ever starts.
The path:
kubectl describe pod <pod>
The events at the bottom contain the actual registry error, and it is nearly always one of four things: the image name or tag is wrong (typo, or a tag that was never pushed), the registry needs credentials the pod does not have (imagePullSecrets missing or in the wrong namespace), the node cannot reach the registry (DNS, node firewall, proxy, air-gapped cluster), or a rate limit. Read the message; do not guess. manifest unknown is a wrong tag, unauthorized is credentials, a timeout is network.
Two details worth knowing: image pull secrets are namespaced, so a secret that works in staging does nothing in prod; and a latest tag that "worked yesterday" can break today because it silently moved.
The model: Image pulling happens on the node, by the container runtime, before any of your code runs. So the failure is always in the pod-spec-to-registry chain: name, auth, or reachability. It cannot be the app, because the app was never started.
3. Pod stuck in Pending
Symptom: Pod shows Pending indefinitely. No restarts, no logs, nothing to read.
The path: A Pending pod has not been placed on a node, so there are no container logs by definition. The scheduler explains itself in the events:
kubectl describe pod <pod>
kubectl get nodes
kubectl describe node <node>
The event text is usually explicit: Insufficient cpu or Insufficient memory means the pod's requests do not fit on any node (check both node capacity and what is already scheduled); node(s) had taint ... that the pod didn't tolerate is a taint/toleration mismatch; unsatisfiable nodeSelector or affinity rules name themselves; and an unbound PersistentVolumeClaim blocks scheduling until storage exists. On managed clusters with autoscaling, Pending can be normal for a minute while a node comes up; the skill is knowing whether your cluster is supposed to do that.
A useful habit: check the namespace's ResourceQuota too. In shared clusters, the quota rejecting your pod produces a different, easily missed failure mode where the pod is never created at all.
The model: Scheduling is a constraint-satisfaction step that happens before anything runs. Pending means "no node satisfies all constraints." Every fix is either relaxing a constraint (requests, selectors, tolerations) or expanding supply (nodes, quota, volumes).
4. Service exists, nothing can reach it
Symptom: The Deployment is healthy, but curl against the Service times out or refuses.
The path: The single highest-value command in Kubernetes networking:
kubectl get endpoints <service>
On current Kubernetes releases, EndpointSlice is the source of truth and the older Endpoints API is deprecated; the modern equivalent is kubectl get endpointslices -l kubernetes.io/service-name=<service> -o wide. Either way, the reading is the same: empty endpoints mean the Service selects no pods, and that is almost always a label mismatch: the Service's selector does not match the pods' labels. Compare them character by character; app: web versus app: web-server has consumed entire afternoons. Endpoints can also be empty because pods exist but are not Ready, which points you back at readiness probes.
If endpoints are populated, verify the port chain: the Service's targetPort must match the port the container actually listens on, and the app must listen on a Pod-reachable interface such as 0.0.0.0, not only on 127.0.0.1. Then test from inside the cluster (a debug pod, kubectl exec) to separate in-cluster connectivity from ingress problems, and check NetworkPolicy - in a default-deny namespace, "nothing can talk to my pod" is the policy working as configured.
The model: A Service is not a proxy in front of your pods, it is a label query that programs routing rules. Empty query, no routing. Once you internalise "Service equals selector plus port mapping," this whole class of failure becomes a two-minute check.
5. OOMKilled
Symptom: Restarts with OOMKilled in the last state; exit code 137. Sometimes it presents as scenario one, which is why you always read the exit code.
The path:
kubectl describe pod <pod>        # last state: OOMKilled, exit code 137
kubectl top pod <pod>             # recent usage, if metrics-server exists
The container exceeded its memory limit and the kernel killed it. Three genuinely different causes hide behind the same event: the limit is simply too low for the workload's honest requirements (fix: raise it, based on observed usage); the app has a leak (usage climbs steadily between restarts; raising the limit only slows the loop); or a load spike made peak usage exceed a limit that is fine on average. Watching the memory curve over time is what distinguishes them, which is an argument for having metrics before you need them.
Runtime-specific traps live here too: Node processes and older JVMs need their own memory settings aligned with the container limit, or they can allocate past it.
The model: Requests are what the scheduler uses for placement; limits are what the kernel enforces. OOMKilled is the enforcement. The question is never "how do I stop Kubernetes killing my pod," it is "why does my process need more memory than I promised it would."
The pattern behind all five
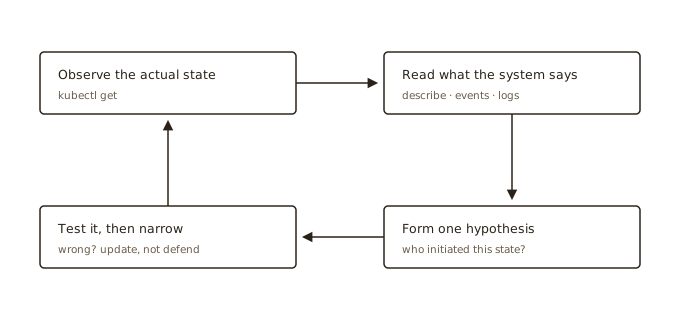
Every path above is the same loop: observe the actual state (get), read what the system says about it (describe, events, logs), form one hypothesis, test it, narrow. The engineers who are good at this are not the ones who memorised the most error strings. They are the ones who know which question to ask next, and who check what is true before deciding what is wrong.
This practice has limits. A laptop cluster cannot reproduce managed-control-plane failures, cloud identity tangles, storage outages, or production traffic patterns. Treat these five as foundations, not a complete map.
That loop is learnable, but only by doing. Break a cluster of your own, on purpose, weekly. The list above is a syllabus.
Where we fit in
This diagnosis loop - not trivia, not YAML from memory - is what SkillBricks assessments measure. You get a live cluster with something genuinely wrong, a real shell, and a scenario with an observer paying attention to your process: what you checked first, how you narrowed, what you did when the first theory failed. Solving scenarios like these, under observation, is how bricks get earned and how your wall gets built. Free for candidates, anonymous by default.
If you read the five paths above and thought "I do exactly that," you are the person we built this for. Start your wall, see how the assessment works, or go break a cluster first. All three are good uses of an evening.