Exit code 139: the one where your own binary is the killer
Exit code 139 means SIGSEGV: the process touched memory it did not own. Container-specific causes, a fast attribution path, and a live repro the naive test gets wrong.
kubernetesdockertroubleshootingtechnical
Exit code 139 means your container died of a segmentation fault: 139 is 128 + 11, and signal 11 is SIGSEGV, which the kernel delivers when a process reads or writes memory it has no mapping for, or in a way the mapping forbids. Unlike its siblings 137 and 143, in practice nobody outside the process decided to kill it; the process earned the signal itself, and the fix almost always lives in the image and the code, not in the knobs you tune for the other two (resources, probes, grace periods).
That inversion is the whole story, and it is why 139 deserves different instincts from the other two kill codes. When 137 shows up, you go hunting for a killer: the kernel's OOM killer, a kubelet acting on a failed probe, someone outside. When 143 shows up, you check whether the shutdown was supposed to happen. When 139 shows up, there is no external suspect to find. Your binary executed an instruction that touched an address it had no right to, and the kernel ended it mid-stride: no shutdown hook, usually no log line, because the crash happens below the level where your application writes logs.
Which also makes it the hardest of the three to debug, and the one the internet covers worst. Most write-ups recycle the same textbook causes without showing how to tell which one you have. This post is the container-specific list, ordered for diagnosis, then the attribution path, then a repro we ran before publishing, including the trap in the obvious version of it.
Why is 139 different from 137 and 143?
All three codes follow the same convention: 128 plus the signal number. But the signals belong to different categories. SIGKILL (137) cannot be caught at all. SIGTERM (143) is a request the process may handle. SIGSEGV sits in a third category: it is catchable in principle, but when the kernel raises it on a genuine memory fault, it is forced. A handler can log a stack trace on the way down; it cannot simply return and carry on, because the faulting instruction re-executes. Runtimes that do recover from segfaults, like the JVM's null-check machinery, repair the mapping or the saved context inside the handler first: deliberate engineering, not something a crashing app does by default.
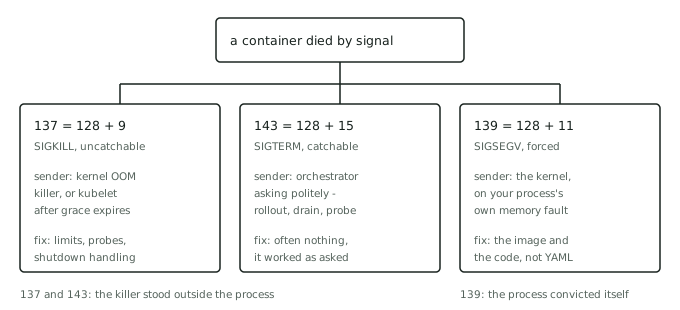
The Kubernetes record reads the same way as its siblings, and starts in the same place:
kubectl get pod <pod> -o jsonpath='{.status.containerStatuses[0].lastState.terminated}'
{ "exitCode": 139, "reason": "Error", "startedAt": "...", "finishedAt": "..." }
Note what is missing: there is no Segfaulted reason the way OOM kills get OOMKilled. You get the generic Error, an exit code, and usually an empty kubectl logs --previous. If the pod is looping rather than dead once, this is the "points at the binary, not the manifest" branch of the CrashLoopBackOff tree. And one common confusion to retire immediately: 139 is not an out-of-memory kill. Running out of memory gets you 137. Touching memory you do not own gets you 139. Raising resources.limits.memory on a segfaulting pod is a category error.
Why does a container segfault when the same code worked elsewhere?
Because containers change the things native code is most sensitive to: the C library, the CPU architecture, the exact bytes of the binary. What follows is roughly the order worth checking when the crash is container-shaped. One family is deliberately excluded: an ordinary memory bug in your own code, whose tell is that it crashes everywhere, not only in the container.
Native dependencies and C extensions. Your Python or Node code is memory-safe; the wheels and addons underneath it are C and C++. A numpy or grpc wheel built for a different environment, a Node addon compiled against a different ABI, a JVM crashing inside JNI code. The interpreter did nothing wrong; its foundation did.
A glibc binary on a musl base, the Alpine trap. Alpine ships musl, not glibc. A binary or prebuilt wheel that expects glibc may refuse to load with a clean error if you are lucky, or load partially and fault later if you are not. If moving from a Debian-based image to Alpine coincided with your 139s, you have your suspect.
A mismatched artifact from a multi-stage build. A COPY --from that grabs output from the wrong stage, a stale build cache that mixes a new binary with an old shared object (an ABI mismatch that loads cleanly and then faults), an artifact built against one stage's environment and run in another. Everything starts, then crashes the first time the mismatched pieces disagree.
The wrong architecture under emulation. An amd64 image on an arm64 machine (or the reverse) that cannot execute at all fails loudly with an exec format error. The nastier case is emulation: run the foreign image under QEMU, as Docker Desktop on Apple Silicon will happily do, and emulation gaps can surface as segfaults in code that is perfectly correct on its native architecture.
Stack overflow. The stack has a fixed ceiling (commonly 8 MiB, visible via ulimit -s), and blowing through it lands on a guard page, which is a memory access violation like any other. Deep or unbounded recursion, especially in native code that managed runtimes cannot guard, exits 139.
Kernel and sandbox interactions, the rare tail. A very old base image can fault on a modern kernel: boot a node with vsyscall=none and a CentOS 5-era glibc segfaults on its first vsyscall. Syscall-filtering sandboxes (seccomp profiles, gVisor) are a more indirect route: a filtered syscall surfaces as an EPERM or ENOSYS error, or as a SIGSYS kill (exit 159, not 139); you reach 139 when code ignores that error and marches on, dereferencing the result of a failed mmap. Suspect this family last, but suspect it, especially right after a node or runtime upgrade.
137 and 143 record a decision someone made about your process. 139 records a mistake your process made about memory.
How do you debug exit code 139 in Kubernetes?
The container's own logs are usually empty, so the evidence lives one level down, on the node. The kernel logs segfaults by default on mainstream distro kernels, but the reporting is rate-limited and configurable (debug.exception-trace), so an absent line is not proof of an absent fault. Reach the node's kernel log however your platform allows (the same privileged kubectl debug node/<node> move as the 137 investigation, or the provider's node console) and grep for segfault. When we ran the repro below on our dev cluster, the node's log read:
python[251017]: segfault at 0 ip 0000709a8f4ad944 sp 00007ffdcf978218
  error 4 in ld-musl-x86_64.so.1[709a8f48d000+59000] likely on CPU 6
One line, three answers. segfault at 0 is the faulting address: address zero means a null pointer dereference. error 4 decodes the access on x86-64: a user-mode read of an unmapped address (writes and protection faults get different values; arm64 nodes log a different format entirely). And the in ... clause names the mapped object the faulting instruction lived in, here musl's loader, because our deliberate null read executed inside the C library. That module name is often enough to pick the cause family on its own: your own binary, a specific native extension's .so, or the C library itself.
If dmesg narrows it but you need the actual backtrace, you want a core dump, and containers make those awkward in two specific ways. First, the size limit: cores must be allowed at all. On our dev cluster the default inside a pod was already ulimit -c reporting unlimited, but check yours. Second, the destination: /proc/sys/kernel/core_pattern is node-global, shared by every container on the host, and the pod cannot change it. On our cluster, reading it from inside a pod showed the node's Ubuntu setting, a pipe to apport, and attempting to write it failed with Read-only file system. A piped pattern means the kernel hands the dump to a helper on the host, so the core never lands in your container's filesystem at all; you retrieve it from the node, or change the pattern node-wide, deliberately.
Which is why the most productive move is often the last one: reproduce locally with the exact same image digest. docker pull the digest from the pod's .status.containerStatuses[].imageID, which records what actually ran (the spec's tag is mutable and may have moved since), run the same command, and test the architecture theory explicitly with --platform. Inside the image, file on the binary answers the architecture question and ldd answers the libc question in seconds. A segfault you can trigger on your laptop with the cluster's image is a solved attribution; only the code-level fix remains.
A repro you can run, and the trap in the obvious one
Here is where 139 connects back to its sibling posts in a way we did not expect until we tested it. The obvious repro is to send the signal yourself, the way you might fake a SIGTERM. We ran exactly that on our dev cluster: a pod whose PID 1 shell executes kill -SEGV 1 against itself. The observed record:
{ "exitCode": 0, "reason": "Completed" }
The container logged still alive after kill -SEGV 1 and exited cleanly. Nothing segfaulted. This is the same PID 1 rule that stops naive SIGTERM handling: the kernel discards catchable signals sent to a namespace's init process unless it installed a handler, and a sent SIGSEGV is just a catchable signal like any other. The naive repro proves nothing except that PID 1 is special. (A second trap for the same experiment: Kubernetes collapses $$ in manifest commands to a literal $, its escape syntax for $(VAR) references, so the shell never sees its own PID. Signal PID 1 explicitly.)
A genuine memory fault is a different beast, because the kernel forces it rather than delivering it politely:
apiVersion: v1
kind: Pod
metadata:
  name: segv-real
spec:
  restartPolicy: Never
  containers:
    - name: app
      image: python:3.12-alpine
      command: ['python', '-c', 'import ctypes; ctypes.string_at(0)']
ctypes.string_at(0) asks C code to read address zero. Same pod shape, same PID 1, and this time the observed record was:
{ "exitCode": 139, "reason": "Error" }
with empty logs, and the dmesg line quoted above waiting on the node. That contrast is the post's whole argument in two pods: PID 1 protection can shrug off any signal you send, and none of that matters to a real fault, because a real fault is not sent. It is imposed.
The honest limit: attribution is not a fix
The path above tells you which cause family you are in and which module faulted. It does not fix the bug. If the answer is a rebuild (correct libc, correct architecture, native deps compiled in-image), the fix is mechanical. If the answer is a genuine memory bug in code you own, the real work starts at the backtrace, and the most useful thing an operations-side engineer can do is hand the developer a core dump and a decoded dmesg line rather than the sentence "it crashed"; the developer opens that core in gdb against the same image's binaries and debug symbols. Two more honest caveats: 128 + 11 is convention, not law (a process can exit with status 139 voluntarily without any fault, and a shell-wrapper PID 1 can relay a child's genuine 128 + 11 as its own exit status); and on locked-down managed platforms, the node-level evidence this post leans on may take a support ticket to reach.
Where we fit in
A pod that dies with exit 139 and empty logs is close to a perfect test of operating skill, which is exactly why interviewers like it: there is nothing to read inside the container, so the only way forward is the evidence chain this post walks, from lastState.terminated to the kernel log to the image itself. Knowing that chain, and knowing why kill -SEGV proves nothing, is the difference between having operated containers and having read about them.
You can practise every step of it in a disposable cluster, and you should; the repro above is safe anywhere. Proving it under observation is the part a repo cannot do for you. On SkillBricks, working a live failure like this end to end becomes a verified brick on your wall: the diagnosis path, recorded, not just the answer. If you already knew where the segfault line lands before this post told you, that is worth proving.