CrashLoopBackOff: the two questions that actually diagnose it
CrashLoopBackOff is a symptom, not a cause. The last exit code and the time-to-death route you to the real failure. A diagnosis path with a runnable repro.
kubernetestroubleshootingdevopstechnical
kubectl get pods, and there it is: STATUS: CrashLoopBackOff, the RESTARTS column climbing while you watch. The received wisdom says check the logs. Sometimes that works. Just as often the logs are empty, or stop mid-line, or describe a perfectly healthy startup right up to the moment there is nothing.
That is because CrashLoopBackOff is not the error. It is Kubernetes telling you it has stopped trying so hard: the container keeps dying, the kubelet keeps restarting it, and the pause between attempts is growing. The status describes the retry schedule. It says precisely nothing about why the container dies.
Which means the diagnosis does not start with the loop at all. It starts with two questions about the last corpse: what exit code did it leave, and how long did it live? Between them, those two answers route almost every crash loop to the right suspect, usually before you have read a single log line.
The loop is a policy, not a diagnosis
The mechanics first, because they explain why the status is so unhelpful. A pod's restartPolicy (default Always) tells the kubelet to restart containers that exit, whatever the reason. When a container keeps exiting, the kubelet backs off: the delay starts at ten seconds and doubles with each crash, capping at five minutes, and it resets only after the container manages ten minutes of clean running. (kubectl describe reports this same state as the event Back-off restarting failed container.)
One boundary before the questions: CrashLoopBackOff means the image arrived and a container ran at least once. If the pull itself is failing, you get ImagePullBackOff instead, a status that keeps its evidence somewhere else entirely and never produces a corpse to interrogate.
So a pod "in CrashLoopBackOff" is, most of the time, doing nothing. The crash already happened, possibly minutes ago; you are looking at the waiting room. The evidence lives in the record Kubernetes keeps of the previous attempt:
kubectl get pod <pod> -o jsonpath='{.status.containerStatuses[0].lastState.terminated}'
The same line we lean on in the exit code 137 post, and deliberately so: it is the single most useful command in pod forensics. It returns the exit code, the reason, and the startedAt/finishedAt timestamps (the [0] assumes a single-container pod; pick the right entry by name otherwise). Question one is the exit code. Question two is finishedAt minus startedAt.
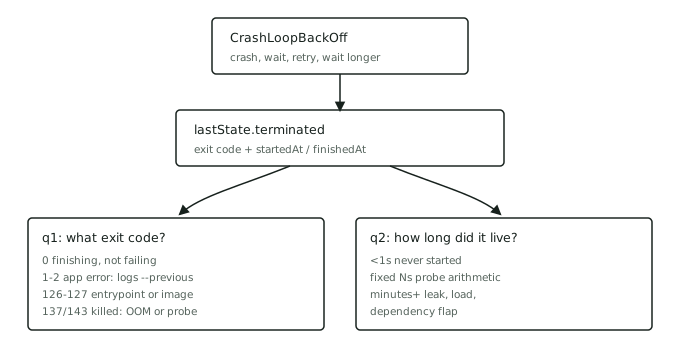
Question one: what was the exit code
Exit 0. The container is not failing. It is finishing, and the restart policy is restarting it anyway (unless a wrapper script is swallowing a real failure and reporting 0 on its behalf, which earns the same loop with less honesty). This is the classic job-shaped process running in a Deployment: a migration script, a one-shot task, a service that daemonises itself so its foreground parent exits. Kubernetes needs a long-running foreground process; a workload that completes belongs in a Job or CronJob, not behind restartPolicy: Always.
Exit 1, 2, and friends. The application exited on its own, which makes this the branch where the container's own logs usually hold the answer. Use kubectl logs <pod> --previous: the current container has not crashed yet, so the evidence is in the previous one. The usual culprits are config-shaped: a missing environment variable, an unparseable config file, a database that refused the connection and an app that treats that as fatal at startup.
Exit 126 or 127. When a shell launches your process, these are its verdicts on the entrypoint: 127 means command not found, 126 means found but not executable. A typo in command:, an image built with a different filesystem layout than the manifest assumes, a script missing its interpreter; the full 126/127 diagnosis, traps included, is its own post. (If the runtime cannot exec the entrypoint at all, you may instead see a StartError with exit 128 and the real message in kubectl describe rather than in any log.)
Exit 137 or 143. The process did not exit; it was killed. 143 is SIGTERM, a shutdown it obeyed; 137 is SIGKILL, a shutdown it never saw. In a loop, the usual senders are the kernel's OOM killer and the kubelet acting on a failed liveness probe; the full lineup of senders, and how to tell them apart, is its own decision tree: we walked the full 137 diagnosis here. A repeating 137 or 143 means something is killing the container on schedule, which is exactly what question two is for.
Exit 139. SIGSEGV: the process crashed on memory access, which points at the binary rather than the manifest. Native dependencies, an incompatible base image, occasionally a genuinely broken build. Rarer in practice, and the fix lives in the image, not the YAML: we walked the full 139 attribution path here.
Question two: how long did it live
The exit code names the death; the lifetime locates it. Three patterns cover nearly everything:
Under a second. The container never really started. Entrypoint problems, an immediate config read that throws, a missing file or permission on the first syscall. Logs are often empty here for the honest reason that nothing lived long enough to write one. This pattern plus exit 126/127/128 is almost always an entrypoint, manifest, or image problem.
A consistent N seconds, every restart. Something with a timer is killing it, and the giveaway is that N never varies. Do the probe arithmetic: the first probe fires after initialDelaySeconds, then one every periodSeconds, and the kill lands after failureThreshold consecutive failures, so roughly initialDelaySeconds + (failureThreshold - 1) x periodSeconds in, plus whatever the shutdown itself takes. If that lands near your observed lifetime, the liveness probe is the killer, and the real question becomes whether the probe is too impatient or the app genuinely fails to come up. The other regular in this slot is an app-side startup timeout against a dependency that is down.
Minutes to hours, irregular. It starts fine and dies under conditions: a leak (lifetimes shrink as traffic grows), memory pressure under load, a flapping dependency. The two questions have done their job at this point; you are no longer debugging a crash loop but the application itself, and that is the broader troubleshooting loop, hypothesis by hypothesis.
The loop is not your error. It is the kubelet rationing retries while the actual evidence sits unread in
lastState.
A repro you can run
Ten minutes in a disposable cluster makes the two questions concrete. These two pods both land in CrashLoopBackOff, with different diseases:
apiVersion: v1
kind: Pod
metadata:
  name: crash-instant
spec:
  containers:
    - name: app
      image: busybox:1.36
      command: ['sh', '-c', 'nosuchcommand']
---
apiVersion: v1
kind: Pod
metadata:
  name: crash-timed
spec:
  containers:
    - name: app
      image: busybox:1.36
      command: ['sh', '-c', 'trap "exit 143" TERM; while true; do sleep 1; done']
      livenessProbe:
        tcpSocket:
          port: 9999
        initialDelaySeconds: 5
        periodSeconds: 5
        failureThreshold: 2
Apply both and watch the loop form:
kubectl apply -f crashloop-demo.yaml && kubectl get pods -w
Watch the gaps between restarts stretch: the first retry comes almost immediately, then ten seconds, then twenty, then forty (kubectl get events keeps the precise timestamps if you want receipts). Then interrogate both corpses with the lastState.terminated command from above. crash-instant shows exit code 127 and a sub-second lifetime: question one and question two both say "never started". crash-timed shows exit code 143 with a lifetime of roughly ten seconds, every single time: the first probe fails at five seconds, the second at ten, and two failures is the threshold. The trap in its command is not decoration. The kernel discards catchable signals that PID 1 has no handler installed for, so without the trap the same pod never acts on the polite kill, sits out the thirty-second grace period, and dies 137 at about forty seconds instead; we ran both variants live to check. That rule, and why it decides whether your containers can ever shut down gracefully, is the exit code 143 story. Same status in kubectl get pods, opposite diagnoses, and neither needed a log line.
The fixes that are not fixes
An honest boundary: the two questions tell you which door the failure is behind. They do not open it. And the most tempting moves at this point mostly relocate the problem:
Deleting the pod or bouncing the deployment resets the backoff timer and the restart counter, which feels like progress for the eight seconds it takes the loop to re-form. Raising failureThreshold until the probe cannot fail does not heal the service the probe was watching. Switching restartPolicy to Never replaces a crash loop with a corpse.
Behind the door is real work: config archaeology, a dependency that needs to be up before your app is honest about starting, a memory profile, occasionally a conversation about whether this process should be a Deployment at all. A crash-loop diagnosis that ends at "restarted it, looks fine now" has not ended; it has scheduled its own recurrence.
Where we fit in
Everything above is a diagnosis you can practise, and the two-question habit transfers far beyond Kubernetes: read the evidence the system already kept before generating new evidence. Working a live crash loop, forming the hypothesis from lastState, and fixing the actual cause under a clock is precisely the operating skill that separates people who have run clusters from people who have read about them.
You can build the habit anywhere: kind on a laptop, the repro above, breaking your own manifests on purpose. What a laptop cannot do is prove the habit to anyone else. On SkillBricks, the same diagnosis performed in a live environment becomes a verified brick on your wall: evidence of the process, not just the fix. If you can walk both questions without looking at this post, that is worth proving.