Exit code 137: what actually killed your container
Exit code 137 means SIGKILL. The kernel OOM killer, a failed liveness probe, or an outside actor: a diagnosis path that tells the three apart, with a runnable repro.
kubernetesdockertroubleshootingtechnical
A container dies, the pod restarts, and kubectl describe leaves you a single number: exit code 137. Search it and the internet answers in unison: out of memory, raise your limits. Sometimes that is right. Often it is a guess dressed up as a diagnosis, and the limit you raise buys you a quieter version of the same problem.
Here is the thing we keep having to say about 137: it tells you less than people think. Your process did not exit. It was killed, with a signal it never had the chance to handle. The number says how it died, not who did it or why. There are three regular suspects, they leave different evidence, and telling them apart takes about two minutes when you know where each one signs its work.
What 137 actually says
Exit codes above 128 encode death by signal: 128 plus the signal number. 137 is 128 + 9, and signal 9 is SIGKILL. The costume varies by reporter (exit status 137 in Docker output, command terminated with exit code 137 from kubectl exec, a bare exit 137 in CI logs), but it is the same fact in every dress. Unlike SIGTERM (which produces 143 when it is the cause of death), SIGKILL cannot be caught, blocked, or handled. The process gets no shutdown hook, flushes no buffers, writes no farewell log line. Whatever your application was going to say on the way down, it never said it.
That is why the container's own logs so rarely explain a 137: the evidence is not inside the container, because the killer was not inside the container. Start with the record Kubernetes keeps instead:
kubectl get pod <pod> -o jsonpath='{.status.containerStatuses[0].lastState.terminated}'
You get the exit code, the reason field, and timestamps. The reason is your first fork in the road: OOMKilled points at the kernel; anything else, or nothing useful, means you keep walking the tree. (And if the pod is stuck restarting rather than dead once, zoom out first: 137 is one branch of the wider CrashLoopBackOff diagnosis.)
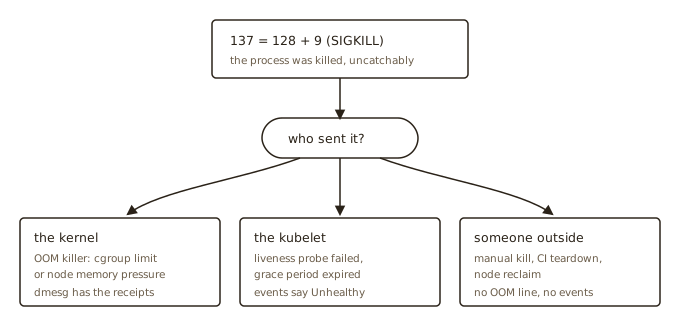
Suspect one: the kernel's OOM killer
The most common killer, and the one everyone assumes. Your container's cgroup has a memory limit; the moment the processes inside it exceed that limit, the kernel's OOM killer picks a victim - scored largely on memory usage, with priority adjustments the kubelet sets (why it chose yours is its own story) - and terminates it with SIGKILL. Kubernetes notices and stamps the container OOMKilled.
But "OOMKilled" covers two different situations, and they have different fixes:
The container hit its own limit. The working set grew past resources.limits.memory. Confirm it by comparing actual usage against the limit over time; if you run Prometheus, watch container_memory_working_set_bytes: it approximates what the kernel cannot reclaim when your cgroup hits its ceiling, which makes it the best predictor of an OOM kill (the enforcement itself happens on the cgroup's own accounting). The question that matters here is whether the ceiling is wrong or the growth is. A JVM or Node service that climbs steadily for six hours and then dies has a leak or an unbounded cache; no limit is big enough for that, and raising it just changes the interval between kills.
The node itself ran out. Under real memory pressure the kernel can kill container processes even when no individual container has exceeded its limit, and the kubelet may also evict pods (evictions show as a distinct Evicted status rather than 137, which is one way to tell the stories apart). The receipts live on the node, not in the pod:
kubectl debug node/<node> -it --profile=sysadmin --image=busybox -- dmesg | grep -i 'killed process'
Reading the kernel log needs a privileged debug profile; on managed platforms that lock it down, the provider's node console or log export holds the same evidence. An OOM line naming your process, with the cgroup path in it, settles which of the two happened. This is also where the confusing case comes from: a 137 without the OOMKilled reason. Read that as attribution missing, not memory innocent: container runtimes sometimes fail to surface the kernel's verdict, a node-level kill is not always attributed back to the pod, and an external SIGKILL never earns the label at all. The kernel-log check settles the first two; the third belongs to the remaining suspects.
One runtime footnote that resolves a surprising share of these: memory-hungry runtimes need to know about the cgroup. Modern JVMs respect container limits by default (UseContainerSupport has been on since JDK 10), and recent Node releases are broadly cgroup-aware, but older Node versions in particular will size their heap from the host's memory rather than the cgroup limit unless --max-old-space-size says otherwise. If your limit and your runtime's idea of available memory disagree, the kernel referees, and it referees with signal 9.
137 is not an error your program made. It is the record of a kill it never saw coming.
Suspect two: the kubelet
A failing liveness probe ends the same way, and this one is routinely misread as a memory problem. The sequence: the probe fails its threshold, the kubelet decides to restart the container, and sends SIGTERM. A healthy process shuts down and you see 143 or a clean exit. But a process that is wedged (deadlocked, GC-thrashing, blocked on a dead dependency) ignores SIGTERM, the terminationGracePeriodSeconds clock runs out, and the kubelet escalates to SIGKILL. Exit code: 137. No OOM anywhere.
The kubelet signs its work in events:
kubectl describe pod <pod> | grep -A3 Unhealthy
Liveness probe failed lines just before the restart are the confession. The fix lives in whichever half was wrong: a probe that is too impatient for the service's real warm-up and pause behaviour (initialDelaySeconds, timeoutSeconds, failureThreshold), or a service that genuinely wedges and needs the probe to catch it, in which case the probe did its job and the investigation moves to why the process hangs.
It is worth being suspicious of coincidences here: a probe that fails because the process is thrashing near its memory limit produces a 137 with OOM-ish symptoms and no OOM record. The two suspects collude. The dmesg check from suspect one is how you split them.
Suspect three: someone outside the cluster
The residual category, and the one that wastes the most hours precisely because nobody suspects it: the kill came from outside the pod's own story. A docker kill or kill -9 by a human or a script. A CI runner tearing down its own job containers on timeout. A spot or preemptible node being drained on its reclaim notice, where a container that outlives the grace period meets the same SIGKILL. And sometimes the node simply vanishes mid-write, which may leave no trustworthy exit record at all: the absence of evidence is itself the tell.
The signature of suspect three is the absence of the other two signatures: no OOM line in the kernel log, no Unhealthy events, often a whole group of containers dying at the same timestamp. When several unrelated pods on one node all exit 137 in the same second, stop reading pod specs and start reading the node's story: was it reclaimed, rebooted, or drained?
A repro you can run
Ten minutes in a disposable cluster (k3s or kind on a laptop is plenty) makes all of this concrete. Apply a pod whose limit you know it will exceed:
apiVersion: v1
kind: Pod
metadata:
  name: oom-demo
spec:
  restartPolicy: Never
  containers:
    - name: hog
      image: python:3.12-alpine
      # iter(int, 1) never yields 1, so the loop is infinite; each pass
      # holds another 10MB. The 64Mi limit ends this quickly.
      command: ['python', '-c', 'a = []; [a.append(" " * 10_000_000) for _ in iter(int, 1)]']
      resources:
        limits:
          memory: '64Mi'
Watch it die and read the record:
kubectl apply -f oom-demo.yaml && kubectl get pod oom-demo -w
kubectl get pod oom-demo -o jsonpath='{.status.containerStatuses[0].lastState.terminated}'
You will see exitCode: 137 with reason: OOMKilled. Then change the experiment: swap the command for one that ignores SIGTERM (sh -c 'trap "" TERM; sleep 3600'), add a tcpSocket liveness probe on a port nothing listens on, and watch the same 137 arrive once the grace period expires, this time with Unhealthy events and no OOM record. Producing both variants yourself is worth more than any amount of reading, because the difference between them is the actual skill.
The honest limit of exit-code archaeology
The decision tree tells you how the process died and who killed it. It does not tell you why memory grew, why the service wedged, or what to change so it stops happening. That next layer is real work: heap profiles, allocation tracking, load patterns, sometimes an architectural conversation about what the service caches and for whom. A 137 diagnosis that ends at "raised the limit to 1Gi" has not found a root cause; it has scheduled a repeat incident for the day traffic doubles.
And occasionally the honest answer is that the limit was simply wrong: the service legitimately needs more than someone guessed two years ago. Right-sizing from observed working-set data, with requests and limits set deliberately rather than copied from a template, is not failure. It is the boring, correct fix, and boring, correct fixes are underrated.
Where we fit in
Everything in this post is a diagnosis path you can practise, and that is not an accident. Working through a live OOMKilled scenario, forming the hypothesis, checking the evidence, and fixing the actual cause under a clock is precisely the operating skill that separates people who have run Kubernetes from people who have read about it. It is also one of the five failure scenarios we walked through here, with the diagnosis loop that generalises past the wedge.
You can build that skill anywhere: a homelab, kind on a laptop, breaking things on purpose the way the repro above does. What a homelab cannot do is prove it to anyone else. On SkillBricks, the same diagnosis performed in a live environment becomes a verified brick on your wall: evidence of the process, not just the fix. If you can walk the 137 tree without looking at this post, that is exactly the kind of thing worth proving.