OOMKilled: why the kernel chose your container
OOMKilled is the kernel's memory verdict, on your limit or the node's. What the cgroup really counts, and the observed oom_score_adj numbers behind who dies first.
kuberneteslinuxtroubleshootingtechnical
OOMKilled means the Linux kernel terminated your container's process with SIGKILL because memory ran out somewhere the kernel holds you accountable: usually your container's own limit, sometimes the node itself. The status appears in kubectl describe alongside exit code 137, and it is the kernel's verdict, not your application's: the process was never asked, warned, or given a chance to object.
If you are mid-incident and need to work out who sent the kill signal, start with our exit code 137 diagnosis path and come back. This post is the companion question, the one that survives the incident review: why did the kernel pick your container? The answer lives in two pieces of machinery most engineers never look at: memory accounting, which decides when your own limit kills you, and victim selection, which decides who dies when the whole node runs short. We read the actual numbers off a live cluster below, because nobody arguing about QoS classes ever seems to show them.
What does the cgroup actually count?
Every container runs inside a cgroup, the kernel's accounting and enforcement unit for resources. Your memory limit becomes memory.max on that cgroup (cgroup v2, the default on current major distros, though v1 boots still exist - stat -fc %T /sys/fs/cgroup answers cgroup2fs if a node is on v2), and the kernel charges the cgroup for every page it allocates on the container's behalf. That last clause is where "my app only uses 300MB" goes wrong, because the cgroup's ledger is wider than your heap:
- Anonymous memory: your heap and stacks, the RSS your APM dashboard shows you. This is usually what people mean by "what my app uses".
- Page cache: file pages the kernel caches when your process reads or writes files. Charged to your cgroup, because you caused them.
- Kernel memory: socket buffers, dentries, page tables. Small individually, real in aggregate.
- tmpfs: a memory-backed
emptyDirvolume counts against the limit in full, and unlike page cache it cannot be reclaimed. Writing a 400Mi file into one is spending 400Mi of your limit for as long as the file holds data: the pages come back only when the data goes (delete the file, truncate it, punch a hole), and on the swapless nodes that are the Kubernetes norm they never page out.
When the total charge reaches memory.max, the kernel does not kill immediately. It first tries to reclaim: drop clean page cache, write back dirty pages. Reclaimable cache is why a container can idle at 90% "usage" for weeks and be fine. Only when reclaim cannot free enough does the OOM killer wake up inside your cgroup, and on cgroup v2 with kubelet 1.28 or newer the whole container dies together (the kubelet sets memory.oom.group; the raw kernel default is off, older kubelets and the singleProcessOOMKill opt-out keep the old shoot-one-process behaviour).
This accounting gap also explains the classic paradox report, "OOMKilled but the dashboard never showed us at the limit". Metrics pipelines sample container_memory_working_set_bytes (total usage minus inactive file cache) every 15 to 60 seconds; enforcement happens on the cgroup's own counter at page-fault speed. A burst allocator can go from comfortable to dead entirely between two scrapes. The dashboard is not lying; it blinked.
Who dies first? QoS classes and oom_score_adj
Accounting decides when a kill happens. Victim selection decides who, and this is where your resource requests quietly become life insurance. When the whole node runs out of memory and the global OOM killer has to choose across every process on the machine, it ranks them by oom_score, which is memory footprint adjusted by a per-process value called oom_score_adj (range -1000 to 1000, higher means killed sooner). The kubelet sets that value for pid 1 of every container, derived from the pod's QoS class: Guaranteed (every container has CPU and memory requests equal to its limits), Burstable (some requests set), or BestEffort (none at all).
Documentation tells you the formula. We wanted the numbers, so we ran one pod of each class in a scratch namespace on our dev cluster (k3s v1.34, kernel 6.8, cgroup v2; one node with 30625824Ki of capacity, about 29.2GiB) and read the value the kubelet actually wrote:
$ for p in qos-guaranteed qos-burstable-small qos-burstable-big qos-besteffort; do
    kubectl exec -n blog-repro $p -- cat /proc/1/oom_score_adj
  done
qos-guaranteed        (requests = limits)   -997
qos-burstable-small   (64Mi request)         998
qos-burstable-big     (4Gi request)          864
qos-besteffort        (no requests)         1000
Read that ladder from the bottom. BestEffort gets 1000, the maximum: first against the wall, by design. Guaranteed gets -997, close to the minimum, in the same protected band as node components. And Burstable is not one number but a sliding scale, 1000 - (1000 x memory request / node capacity), clamped between 2 and 999. Our 64Mi-request pod scored 998, barely distinguishable from BestEffort; the 4Gi-request pod scored 864. Both numbers match the kubelet's formula to the digit.
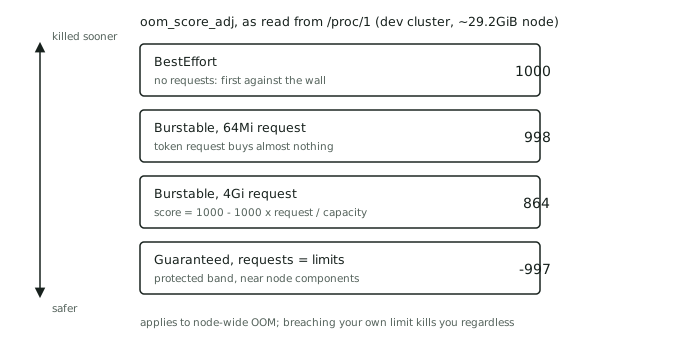
The practical reading: on a Burstable pod, your memory request is not just scheduler bookkeeping, it is literally subtracted from your kill priority, scaled by node size. A token 64Mi request on a 29GiB node buys you almost nothing (998 versus 1000). Requesting what you genuinely need moves you meaningfully down the ladder.
Your memory request is not paperwork for the scheduler. It is the number the kernel reads when it decides who dies.
One scoping caveat that trips people in interviews: oom_score_adj settles node-wide OOM events. When a container breaches its own memory.max, the killer operates inside that cgroup alone, and no QoS class saves you from your own limit. Guaranteed pods still get OOMKilled; they are just nearly immune to dying for a neighbour's sins.
What do requests and limits mean in accounting terms?
Strip away the YAML and the two fields do entirely different jobs. The limit is enforcement: it becomes memory.max, the ceiling the cgroup charge is checked against on every allocation. The request is bookkeeping with teeth: the scheduler uses it to place the pod, the kubelet feeds it into the oom_score_adj formula above, and eviction ranking (next section) compares your actual usage against it. Memory requests are not enforced at runtime; a pod requesting 128Mi can happily use 2Gi if the limit allows.
Which is why "just copy the resources block from the other deployment" is a worse habit than it looks. You are not copying a performance setting. You are copying someone else's position in the kill order and someone else's eviction exposure, calibrated for a workload that is not yours.
OOMKilled or Evicted: which kill did you have?
Three different mechanisms end pods over memory, and they leave different paperwork. Conflating them sends you tuning the wrong knob.
The cgroup OOM kill. Your container exceeded its own limit; the kernel killed it inside the cgroup. Status: OOMKilled, exit code 137, restart in place under the pod's restartPolicy (looping kills land you in CrashLoopBackOff). Fix territory: the container's limit, or the growth.
The kubelet eviction. The node is running low, and the kubelet notices before the kernel panics: available memory has crossed an eviction threshold (by default, hard eviction at memory.available below 100Mi). The kubelet picks victims deliberately, in order: pods whose usage exceeds their requests first (all BestEffort pods qualify by definition, since their request is zero), then by pod priority, then by how far usage exceeds requests. The pod is killed with a grace period and stamped Evicted, a pod-level status, not a container exit code. It is not rescheduled by the kubelet; something (a ReplicaSet, usually) must recreate it elsewhere.
The node-level OOM kill. Memory pressure outran the kubelet's housekeeping loop, the kernel hit a wall, and the global OOM killer chose among the eligible processes on the machine, weighing each one's memory footprint against the oom_score_adj ladder we measured above. The ladder biases the verdict heavily, but it is a bias, not a script: a big enough footprint can flip neighbours on the same rung, and a score of -1000 is outright immunity. From the pod's side this looks like an OOMKilled container, but the trigger was the node, not your limit, and the evidence lives in the node's kernel log rather than the pod record.
The tell, then: Evicted in pod status means the kubelet's orderly retreat; OOMKilled means the kernel, and whether it was your own limit or the node's exhaustion is best read from the container cgroup's memory.events, as a delta across the incident: oom_kill rising together with a local oom event says the cgroup hit its own memory.max; oom_kill rising with no local oom points at the global killer. The counters are cumulative, so compare before and after, and let the node's kernel log corroborate. The 137 post walks the full evidence chain, including the repro.
How do you right-size instead of guessing?
Everything above converts into one operational habit: set requests and limits from observed working-set data, not from templates. The number to watch is container_memory_working_set_bytes over at least a week of real traffic - the closest exported proxy for memory the kernel cannot easily reclaim, and the same number the kubelet's eviction maths uses. It is a proxy, not the enforcement counter: it still counts reclaimable active file cache, a scrape can miss a burst entirely, and the kill fires on the cgroup's raw charge. Size from its observed peaks and leave burst headroom the metric cannot show you.
A defensible starting posture for a typical service: request at or just above the steady-state working set peak, limit with enough headroom over the request to absorb bursts you have actually seen, plus margin. That keeps you honestly schedulable, buys a low oom_score_adj, and keeps eviction ranking on your side, since your real usage sits at or under your request. For components you cannot afford to lose to a noisy neighbour, requests equal to limits (Guaranteed) trades bin-packing efficiency for that -997.
The honest limit of the machinery view
None of this tells you why your memory grew. The accounting explains what counted against you, the ladder explains why you were chosen, and neither will find the unbounded cache or the leaking connection pool; that is heap-profile work, and it is the harder half. There is also drift: kubelet defaults, eviction thresholds, and the exact scoring have shifted across versions, and our numbers are one node on one version (read yours with the same one-liner). The mechanism is stable; the constants are not a contract.
Where we fit in
Explaining the kill ladder is exactly the kind of thing that sounds like trivia in an interview and is nothing of the sort on call: it is the difference between raising a limit at 3am and knowing why the platform pod died for the batch job's sins. That distinction is hard to prove by talking. It shows when someone hands you a namespace where memory is behaving badly and watches what you check first, which is how our live troubleshooting scenarios work.
You can rehearse all of it the way we wrote this post: a scratch namespace, four pods, one cat /proc/1/oom_score_adj. What the rehearsal cannot do is show anyone you did it. On SkillBricks, the same diagnosis performed live becomes a verified brick on your wall, and if you can explain why the kernel chose the victim it chose, that is worth proving.